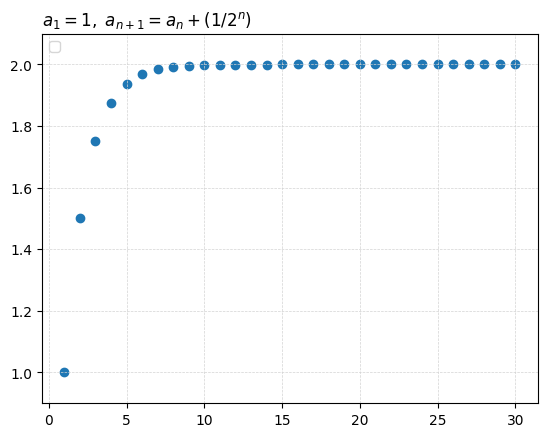
Calculus 10: Generating & Coding A Sequence

From Ch10-1 Sequences, Thomas 13e pp.581
calculus
Author

Tony Phung

Published

January 20, 2025

1. Workout

  • Ex-10-Ex-7: \(a_1=1,\ a_{n+1}=a_n+(1/2^n)\) (code & chart: done)
  • Ex-10-Ex-9: \(a_1=2,\ a_{n+1}=1^{n+1}a_n/2\) (code & charts: tba)
  • Ex-10-Ex-11: \(a_1=a_2=1,\ a_{n+2}=a_{n+1}+a_n\) (code & charts: tba)

Notes:

  • Exercise 7-11 (odd only, workout-only)
  • Exercise 7 (workout, term-generation, and charting)

2. Ex-10-Ex-7: \(a_1=1,\ a_{n+1}=a_n+(1/2^n)\)

2.1 Ex-7: Attempt 1

a_n = 1
n = 1
seq_fracs_list = [(1,1)]
for n in range(1,10):
    if n == 1:
        a_n = 1
    a_n1 = a_n + (1/2**n)
    seq_fracs_list.append((n+1,a_n1)) # append to list
    a_n = a_n1
seq_fracs_list
[(1, 1),
 (2, 1.5),
 (3, 1.75),
 (4, 1.875),
 (5, 1.9375),
 (6, 1.96875),
 (7, 1.984375),
 (8, 1.9921875),
 (9, 1.99609375),
 (10, 1.998046875)]

2.2 Ex-7: Attempt 2: separate numerator & denomator

from fractions import Fraction

a_n = 1
n = 1
seq_fracs_list = [(1,1)]
nvals=30
for n in range(1,nvals):
    if n == 1:
        a_n = 1
    a_n1 = a_n + (1/2**n)
    seq_fracs_list.append((n+1,a_n1,Fraction(a_n1))) # append to list
    a_n = a_n1
    
seq_fracs_list
[(1, 1),
 (2, 1.5, Fraction(3, 2)),
 (3, 1.75, Fraction(7, 4)),
 (4, 1.875, Fraction(15, 8)),
 (5, 1.9375, Fraction(31, 16)),
 (6, 1.96875, Fraction(63, 32)),
 (7, 1.984375, Fraction(127, 64)),
 (8, 1.9921875, Fraction(255, 128)),
 (9, 1.99609375, Fraction(511, 256)),
 (10, 1.998046875, Fraction(1023, 512)),
 (11, 1.9990234375, Fraction(2047, 1024)),
 (12, 1.99951171875, Fraction(4095, 2048)),
 (13, 1.999755859375, Fraction(8191, 4096)),
 (14, 1.9998779296875, Fraction(16383, 8192)),
 (15, 1.99993896484375, Fraction(32767, 16384)),
 (16, 1.999969482421875, Fraction(65535, 32768)),
 (17, 1.9999847412109375, Fraction(131071, 65536)),
 (18, 1.9999923706054688, Fraction(262143, 131072)),
 (19, 1.9999961853027344, Fraction(524287, 262144)),
 (20, 1.9999980926513672, Fraction(1048575, 524288)),
 (21, 1.9999990463256836, Fraction(2097151, 1048576)),
 (22, 1.9999995231628418, Fraction(4194303, 2097152)),
 (23, 1.999999761581421, Fraction(8388607, 4194304)),
 (24, 1.9999998807907104, Fraction(16777215, 8388608)),
 (25, 1.9999999403953552, Fraction(33554431, 16777216)),
 (26, 1.9999999701976776, Fraction(67108863, 33554432)),
 (27, 1.9999999850988388, Fraction(134217727, 67108864)),
 (28, 1.9999999925494194, Fraction(268435455, 134217728)),
 (29, 1.9999999962747097, Fraction(536870911, 268435456)),
 (30, 1.9999999981373549, Fraction(1073741823, 536870912))]

2.3 Ex-7: Attempt 2: get xs & ys

xs = [tple[0] for tple in seq_fracs_list[0:nvals]]
ys = [tple[1] for tple in seq_fracs_list[0:nvals]]

2.4 Ex-7: Attempt 2: Chart

from matplotlib.ticker import MaxNLocator
import numpy as np
import matplotlib.pyplot as plt
import matplotlib.ticker as ticker
### x-values ###
# xpt = 0.01
xpt = 1.5
x_deviation = 0.5
# x_increments = 21
x_increments = x_deviation*2+1
xs_min = xpt - x_deviation
xs_max = xpt + x_deviation
# xs = np.linspace(xs_min, xs_max, x_increments)  # XS
xs = xs
# print(xs)
### exclude x-values ### (eg f(x!=0)=1/x, f(x>0)=log(x))
# xs = xs[xs != 0]
# xs = xs[xs > 0]
# xs = xs[xs > 0]
# print(xs)
### the function ###
# lbl_fx = r'$f(x)= 6.1t^{2}-9.28t+16.43$'   # LABEL
# lbl_fx = r'$\lim_{h \rightarrow 0} \frac{a^h-1}{h}$'   # LABEL
# lbl_fx = r'$a_n= \frac{1-n}{n^2}$'
lbl_fx = r'$a_1=1,\ a_{n+1}=a_n+(1/2^n)$'
# fx_fx = lambda x: np.log(x)  # f(x)
# fx_fx       = lambda n:       (1-n)/n**2 # f(x)
# fx_fx       = lambda n:      1+(1/(2**n)) # f(x)
# fx_fx0_5    = lambda h:    (0.5**h-1)/h  # f(x)
# fx_fx2_5    = lambda h:    (2.5**h-1)/h  # f(x)
# fx_fx1_5    = lambda h:    (1.5**h-1)/h  # f(x)
# fx_fx2      = lambda h:      (2**h-1)/h  # f(x)
# fx_fx3      = lambda h:      (3**h-1)/h  # f(x)
# fx_fx10      = lambda h:      (10**h-1)/h  # f(x)

### y-values ###
# ys_fx = fx_fx(xs)
ys_fx = ys
print(ys_fx)
# ypt_fx = fx_fx(xpt)
# print(f"ypt_fx_at_P(x={xpt}): {ypt_fx}")

# ys_fx0_5 = fx_fx0_5(xs)
# ys_fx2_5 = fx_fx2_5(xs)
# ys_fx1_5 = fx_fx1_5(xs)
# ys_fx2 = fx_fx2(xs)
# ys_fx3 = fx_fx3(xs)
# ys_fx10 = fx_fx10(xs)

### fractions? ###
# lbl_denom = r'$f(x)=x-2$'
# fx_denom = lambda x: x-2
# ys_denom = fx_denom(xs)

### derivative ###
# lbl_dydx = r"$f'(x)=6.10*(2t)-9.28$ (dydx or slope fn)"
# fx_dydx = lambda x: 6.1*(2*x)-9.28
# xpt_dydx = xpt
# dydx = fx_dydx(xpt_dydx)
# print(f"ypt_dydx_at_P(x={xpt_dydx}): {dydx}")

### tangent ###
# c_tangent = ypt_fx-(dydx)*(xpt)
# tgt = "tangent"
# lbl_tangent = rf'$f_t(x)={dydx:,.1f}t+{c_tangent:,.1f}$ (tangent at x={xpt})'
# fx_tangent = lambda x: dydx*xs+c_tangent
# ys_tangent = fx_tangent(xs)

### plot things ####
# plt.plot(xs, ys_fx,  'r^-', linewidth=2, markersize=6, label=lbl_fx)
# plt.plot(xs, ys_fx,  'r^-', linewidth=2, markersize=6, label="base 2")
# plt.plot(xs, ys_fx0_5,  'bo-', linewidth=2, markersize=6, label="base $a$: 0.5")
# plt.plot(xs, ys_fx2_5,  'gv--', linewidth=2, markersize=6, label="base $a$: 2.5")
# plt.plot(xs, ys_fx1_5,  'y^-.', linewidth=2, markersize=6, label="base $a$: 1.5")
# plt.plot(xs, ys_fx2,  'c<-', linewidth=2, markersize=6, label="base $a$: 2")
# plt.plot(xs, ys_fx3,  'm>:', linewidth=2, markersize=6, label="base $a$: 3")
# plt.plot(xs, ys_fx10,  'k-.', linewidth=2, markersize=6, label="base $a$: 10")
plt.scatter(xs, ys_fx, marker="o")
# plt.plot(xs, ys_tangent,      'yo-', linewidth=2, markersize=6, label=lbl_tangent)
# plt.plot(xs, ys_denom,      'bo-', linewidth=2, markersize=8, label=lbl_denom)
# plt.scatter(x=xpt, y=fx_fx(xpt), marker="o")

##### EXTRAS: title, grid, legend, zooming, ticks, hline, vline, tickers #####

# title
# plot_title = lbl_fx + f" & it's tangent at x={xpt}"
# plot_title = lbl_fx + "at (4,2)"
plot_title = lbl_fx
# plot_title = lbl_denom + " and " + lbl_denom + "at (3,3)"
# plot_title = lbl_fx + " and " + lbl_tangent + "at (4,2)"
plt.title(plot_title, loc='left')

# grid 
plt.grid(color='lightgrey', linestyle='--', linewidth=0.5)

# legend plt.legend(loc='upper right')
# plt.legend(loc='lower right')
plt.legend(loc='upper left')

# zoom! enhance! #
# plt.xlim(xpt-5,xpt+5)  # x-rng
# plt.xlim(,xs_max)  # x-rng
plt.ylim(0.9, 2.1)  # y-rng

# vertical, horizontal, 
# ax = plt.gca()  # Get the current axis
# ax.axvline(x=xpt, color='grey', linestyle='--', linewidth=0.5)
# ax.axhline(y=fx_fx(xpt), color='grey', linestyle='--', linewidth=0.5)
# ax.axvline(x=0, color='grey', linestyle='--', linewidth=0.5)
# ax.axhline(y=0, color='grey', linestyle='--', linewidth=0.5)


# X-LIMIT & VALUE
# plt.vlines(x_at_c,linestyles="dotted", ymin=plt.ylim()[0], ymax=max(ys)) # non-monotonic
# plt.plot(x_at_c, 0.5,marker="o",markersize=15, markerfacecolor='none', markeredgecolor='red')

# OTHER
# b+-- , o:b , r^ , bo    plt.xlabel("") 
# plt.ylim(bottom=0)  # chart starts from y=0
# ax.yaxis.set_minor_locator(ticker.MultipleLocator(0.000025)) # minor ticks
# ref: https://matplotlib.org/stable/users/explain/axes/axes_ticks.html

[1, 1.5, 1.75, 1.875, 1.9375, 1.96875, 1.984375, 1.9921875, 1.99609375, 1.998046875, 1.9990234375, 1.99951171875, 1.999755859375, 1.9998779296875, 1.99993896484375, 1.999969482421875, 1.9999847412109375, 1.9999923706054688, 1.9999961853027344, 1.9999980926513672, 1.9999990463256836, 1.9999995231628418, 1.999999761581421, 1.9999998807907104, 1.9999999403953552, 1.9999999701976776, 1.9999999850988388, 1.9999999925494194, 1.9999999962747097, 1.9999999981373549]
/tmp/ipykernel_16221/1066855485.py:98: UserWarning: No artists with labels found to put in legend.  Note that artists whose label start with an underscore are ignored when legend() is called with no argument.
  plt.legend(loc='upper left')