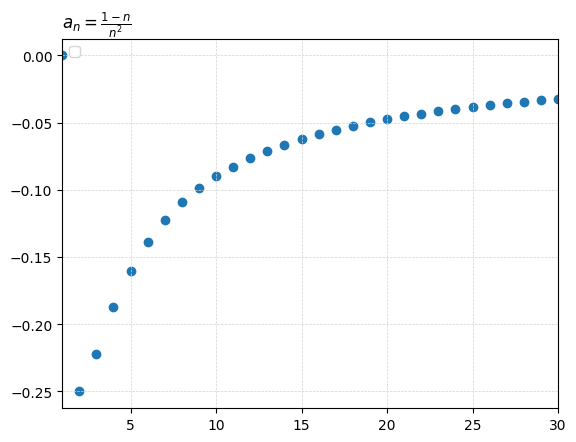
from matplotlib.ticker import MaxNLocatorimport numpy as npimport matplotlib.pyplot as pltimport matplotlib.ticker as ticker### x-values ### # xpt = 0.01 = 0.00 = 30 # x_increments = 21 = x_deviation* 2 + 1 = xpt - x_deviation= xpt + x_deviation= np.linspace(xs_min, xs_max, x_increments) # XS # print(xs) ### exclude x-values ### (eg f(x!=0)=1/x, f(x>0)=log(x)) # xs = xs[xs != 0] # xs = xs[xs > 0] = xs[xs > 0 ]print (xs)### the function ### # lbl_fx = r'$f(x)= 6.1t^{2}-9.28t+16.43$' # LABEL # lbl_fx = r'$\lim_{h \rightarrow 0} \frac{a^h-1}{h}$' # LABEL = r' $ a_n= \f rac{1-n}{n ^ 2} $ ' # fx_fx = lambda x: np.log(x) # f(x) = lambda n: (1 - n)/ n** 2 # f(x) # fx_fx0_5 = lambda h: (0.5**h-1)/h # f(x) # fx_fx2_5 = lambda h: (2.5**h-1)/h # f(x) # fx_fx1_5 = lambda h: (1.5**h-1)/h # f(x) # fx_fx2 = lambda h: (2**h-1)/h # f(x) # fx_fx3 = lambda h: (3**h-1)/h # f(x) # fx_fx10 = lambda h: (10**h-1)/h # f(x) ### y-values ### = fx_fx(xs)print (ys_fx)# ypt_fx = fx_fx(xpt) # print(f"ypt_fx_at_P(x={xpt}): {ypt_fx}") # ys_fx0_5 = fx_fx0_5(xs) # ys_fx2_5 = fx_fx2_5(xs) # ys_fx1_5 = fx_fx1_5(xs) # ys_fx2 = fx_fx2(xs) # ys_fx3 = fx_fx3(xs) # ys_fx10 = fx_fx10(xs) ### fractions? ### # lbl_denom = r'$f(x)=x-2$' # fx_denom = lambda x: x-2 # ys_denom = fx_denom(xs) ### derivative ### # lbl_dydx = r"$f'(x)=6.10*(2t)-9.28$ (dydx or slope fn)" # fx_dydx = lambda x: 6.1*(2*x)-9.28 # xpt_dydx = xpt # dydx = fx_dydx(xpt_dydx) # print(f"ypt_dydx_at_P(x={xpt_dydx}): {dydx}") ### tangent ### # c_tangent = ypt_fx-(dydx)*(xpt) # tgt = "tangent" # lbl_tangent = rf'$f_t(x)={dydx:,.1f}t+{c_tangent:,.1f}$ (tangent at x={xpt})' # fx_tangent = lambda x: dydx*xs+c_tangent # ys_tangent = fx_tangent(xs) ### plot things #### # plt.plot(xs, ys_fx, 'r^-', linewidth=2, markersize=6, label=lbl_fx) # plt.plot(xs, ys_fx, 'r^-', linewidth=2, markersize=6, label="base 2") # plt.plot(xs, ys_fx0_5, 'bo-', linewidth=2, markersize=6, label="base $a$: 0.5") # plt.plot(xs, ys_fx2_5, 'gv--', linewidth=2, markersize=6, label="base $a$: 2.5") # plt.plot(xs, ys_fx1_5, 'y^-.', linewidth=2, markersize=6, label="base $a$: 1.5") # plt.plot(xs, ys_fx2, 'c<-', linewidth=2, markersize=6, label="base $a$: 2") # plt.plot(xs, ys_fx3, 'm>:', linewidth=2, markersize=6, label="base $a$: 3") # plt.plot(xs, ys_fx10, 'k-.', linewidth=2, markersize=6, label="base $a$: 10") = "o" )# plt.plot(xs, ys_tangent, 'yo-', linewidth=2, markersize=6, label=lbl_tangent) # plt.plot(xs, ys_denom, 'bo-', linewidth=2, markersize=8, label=lbl_denom) # plt.scatter(x=xpt, y=fx_fx(xpt), marker="o") ##### EXTRAS: title, grid, legend, zooming, ticks, hline, vline, tickers ##### # title # plot_title = lbl_fx + f" & it's tangent at x={xpt}" # plot_title = lbl_fx + "at (4,2)" = lbl_fx# plot_title = lbl_denom + " and " + lbl_denom + "at (3,3)" # plot_title = lbl_fx + " and " + lbl_tangent + "at (4,2)" = 'left' )# grid = 'lightgrey' , linestyle= '--' , linewidth= 0.5 )# legend plt.legend(loc='upper right') # plt.legend(loc='lower right') = 'upper left' )# zoom! enhance! # # plt.xlim(xpt-5,xpt+5) # x-rng 1 ,xs_max) # x-rng # plt.ylim(-0.1, 0.1) # y-rng # vertical, horizontal, # ax = plt.gca() # Get the current axis # ax.axvline(x=xpt, color='grey', linestyle='--', linewidth=0.5) # ax.axhline(y=fx_fx(xpt), color='grey', linestyle='--', linewidth=0.5) # ax.axvline(x=0, color='grey', linestyle='--', linewidth=0.5) # ax.axhline(y=0, color='grey', linestyle='--', linewidth=0.5) # X-LIMIT & VALUE # plt.vlines(x_at_c,linestyles="dotted", ymin=plt.ylim()[0], ymax=max(ys)) # non-monotonic # plt.plot(x_at_c, 0.5,marker="o",markersize=15, markerfacecolor='none', markeredgecolor='red') # OTHER # b+-- , o:b , r^ , bo plt.xlabel("") # plt.ylim(bottom=0) # chart starts from y=0 # ax.yaxis.set_minor_locator(ticker.MultipleLocator(0.000025)) # minor ticks # ref: https://matplotlib.org/stable/users/explain/axes/axes_ticks.html