xpt = 5
x_deviation = 2
x_increments = 21
xs_min = xpt - x_deviation
xs_max = xpt + x_deviation
xs = np.linspace(xs_min, xs_max, x_increments) # XS
# # X-EXCLUDE LIMIT VALUE
# xs = xs[xs != 1]
# xs = xs[xs >= 0]
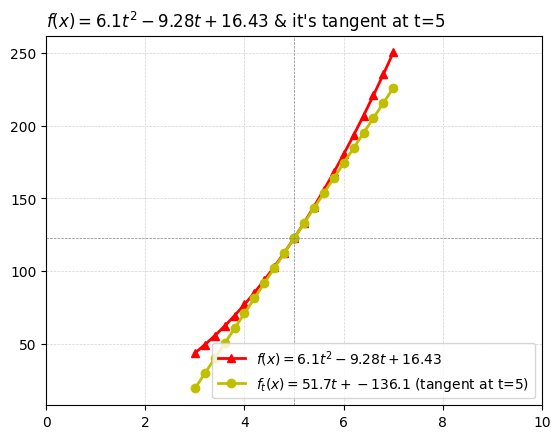
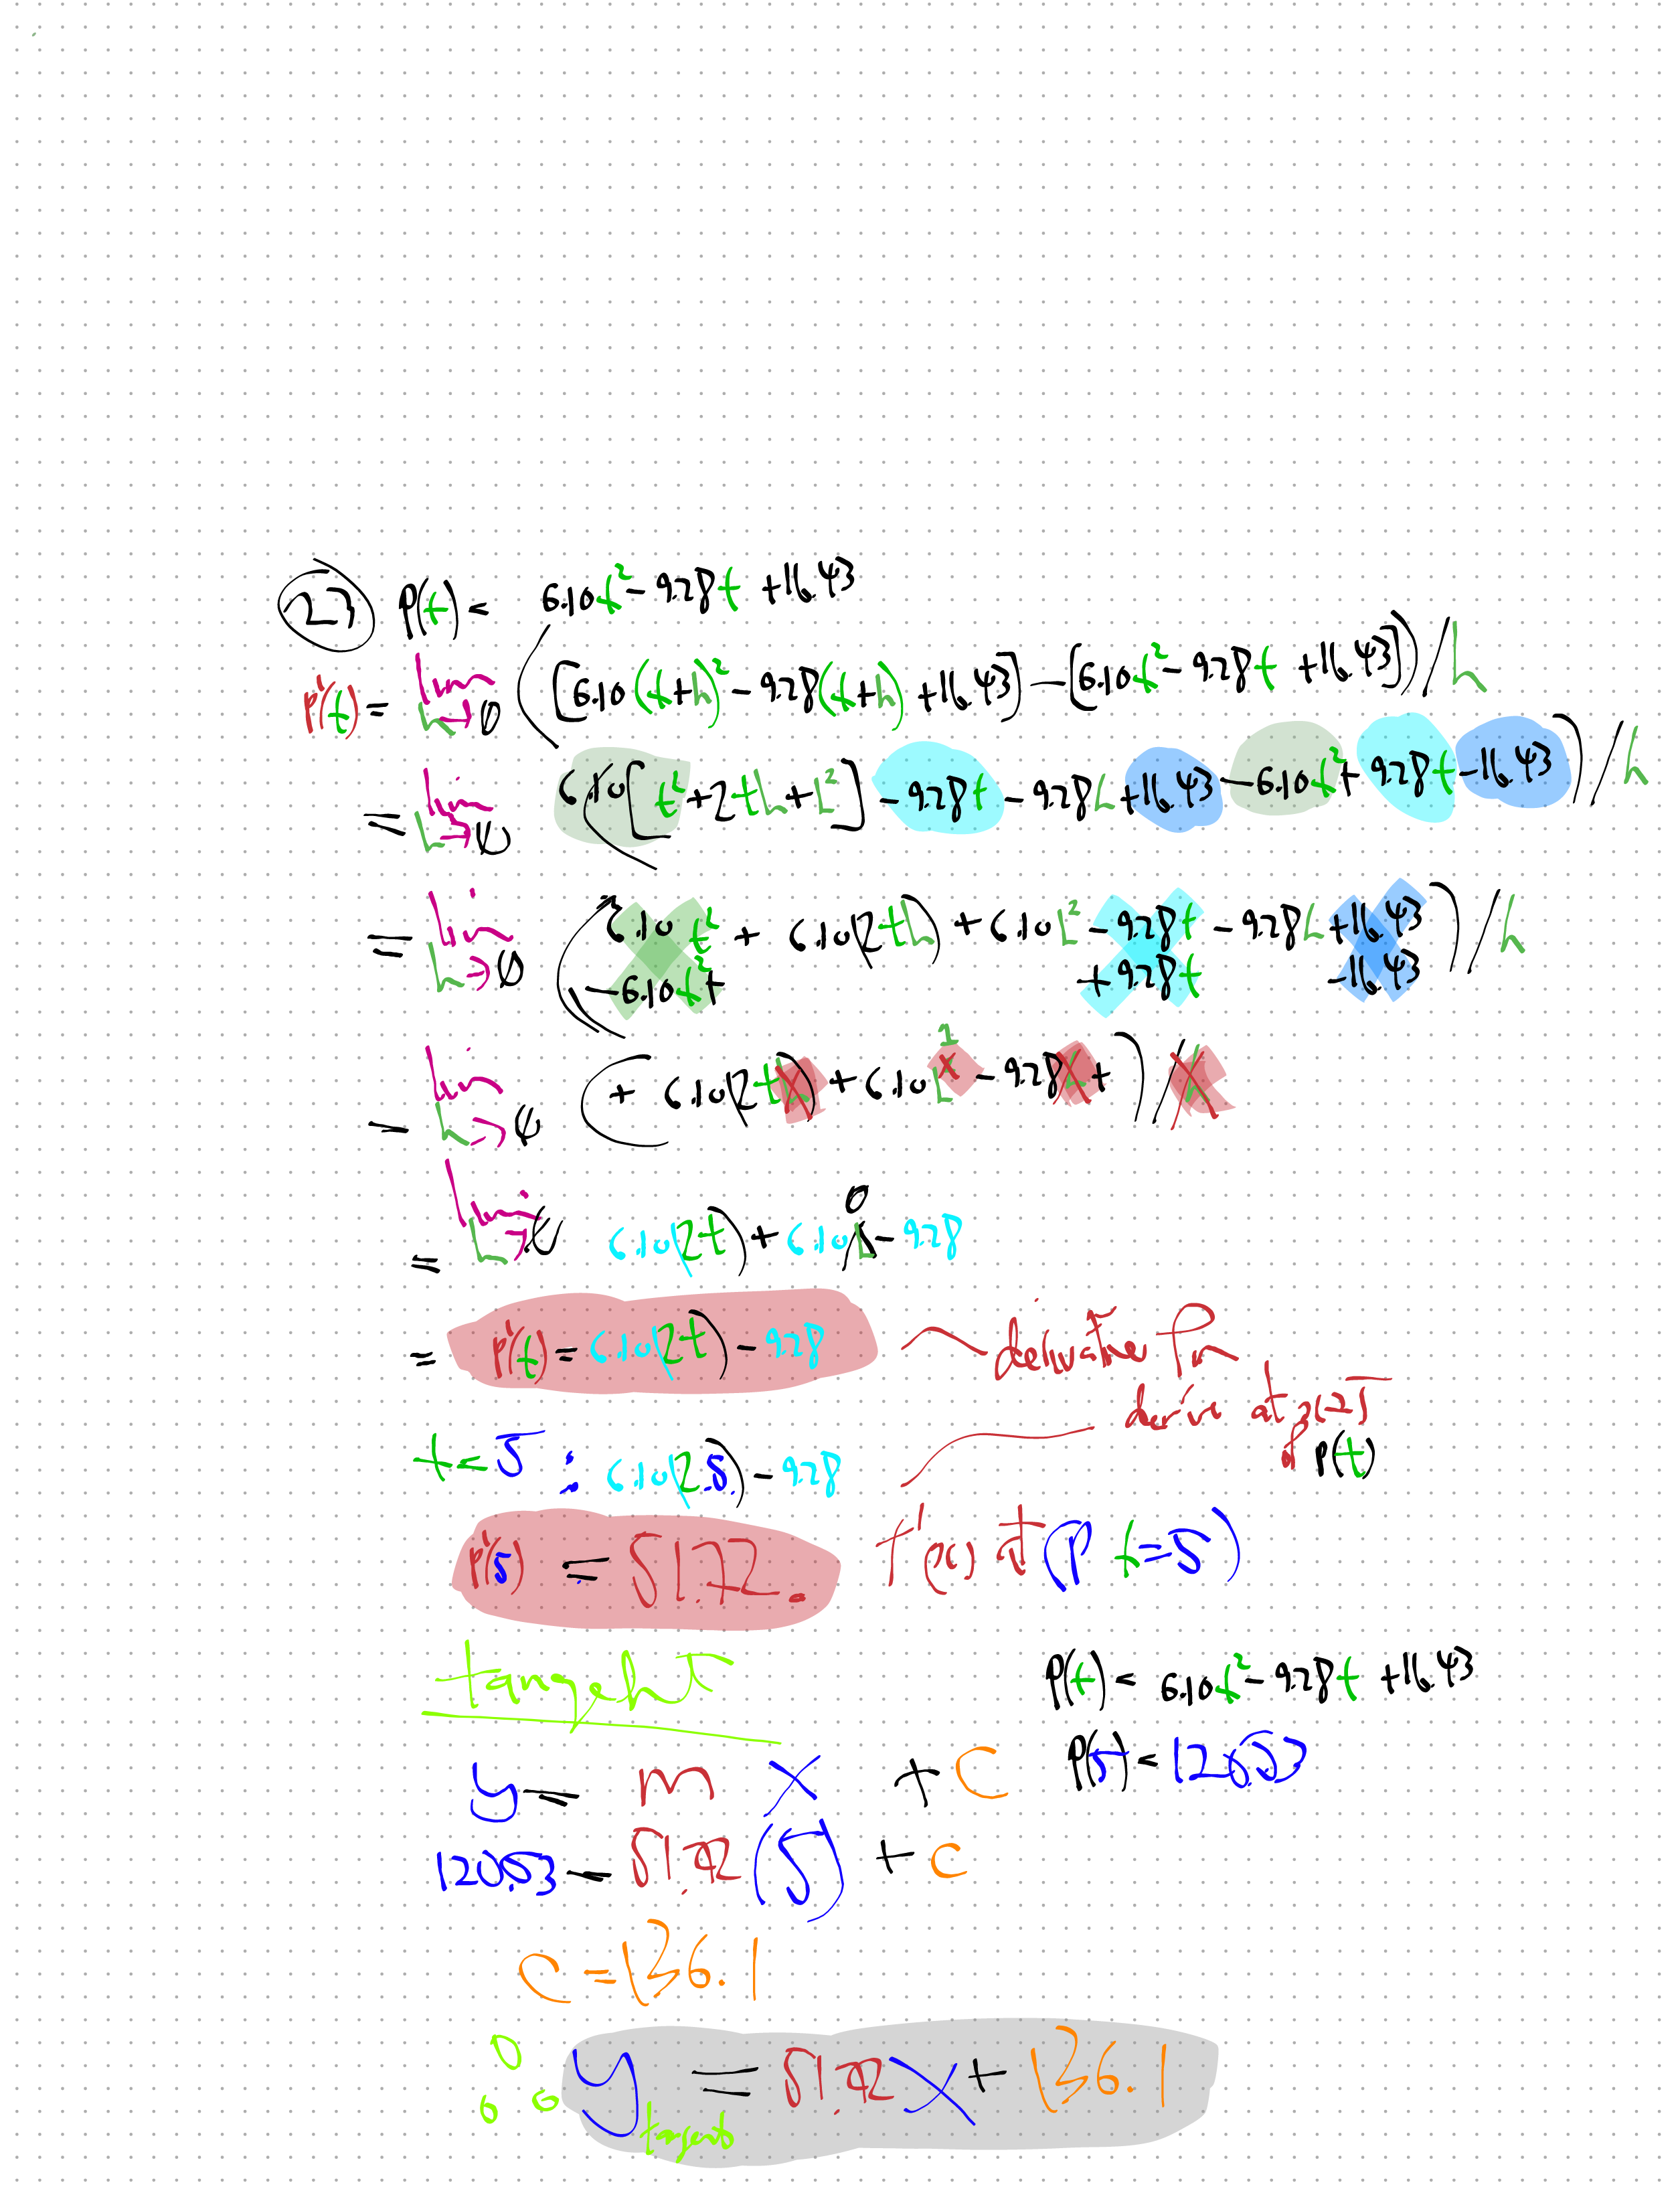
lbl_numerator = r'$f(x)= 6.1t^{2}-9.28t+16.43$' # LABEL
fx_numerator = lambda x: 6.1*(x**2)-9.28*x+16.43 # F(X)
ys_numerator = fx_numerator(xs) # YS = F(XS)
ypt_fx = fx_numerator(xpt)
print(f"ypt_fx_at_P(x={xpt}): {ypt_fx}")
# lbl_denom = r'$f(x)=x-2$'
# fx_denom = lambda x: x-2
# ys_denom = fx_denom(xs)
lbl_dydx = r"$f'(x)=6.10*(2t)-9.28$ (dydx or slope fn)"
fx_dydx = lambda x: 6.1*(2*x)-9.28
xpt_dydx = xpt
dydx = fx_dydx(xpt_dydx)
print(f"ypt_dydx_at_P(x={xpt_dydx}): {dydx}")
c_tangent = ypt_fx-(dydx)*(xpt)
tgt = "tangent"
lbl_tangent = rf'$f_t(x)={dydx:,.1f}t+{c_tangent:,.1f}$ (tangent at t={xpt})'
fx_tangent = lambda x: dydx*xs+c_tangent
ys_tangent = fx_tangent(xs)
plot_title = lbl_numerator + f" & it's tangent at t={xpt}"
# plot_title = lbl_numerator + "at (4,2)"
# plot_title = lbl_denom + " and " + lbl_denom + "at (3,3)"
# plot_title = lbl_numerator + " and " + lbl_tangent + "at (4,2)"
plt.plot(xs, ys_numerator, 'r^-', linewidth=2, markersize=6, label=lbl_numerator)
# plt.scatter(xs, ys_numerator, marker="o")
# plt.plot(xs, ys_denom, 'bo-', linewidth=2, markersize=8, label=lbl_denom)
plt.plot(xs, ys_tangent, 'yo-', linewidth=2, markersize=6, label=lbl_tangent)
# zoom and enhance!
plt.xlim(xpt-5,xpt+5) # X-axis range
# plt.ylim(-0.1, 0.1) # Y-axis range
# Add grid, title, and legend
plt.grid(color='lightgrey', linestyle='--', linewidth=0.5)
plt.title(plot_title, loc='left')
# plt.title(r"$12*x+16$", loc='left')
# plt.legend(loc='upper right')
plt.legend(loc='lower right')
# Optionally, add vertical and horizontal lines to highlight the zoomed area
ax = plt.gca() # Get the current axis
ax.axvline(x=xpt, color='grey', linestyle='--', linewidth=0.5)
ax.axhline(y=fx_numerator(xpt), color='grey', linestyle='--', linewidth=0.5)
plt.scatter(x=xpt, y=fx_numerator(xpt), marker="o")
# print(fx_numerator(5))