from matplotlib.ticker import MaxNLocator
import numpy as np
import matplotlib.pyplot as plt
import matplotlib.ticker as ticker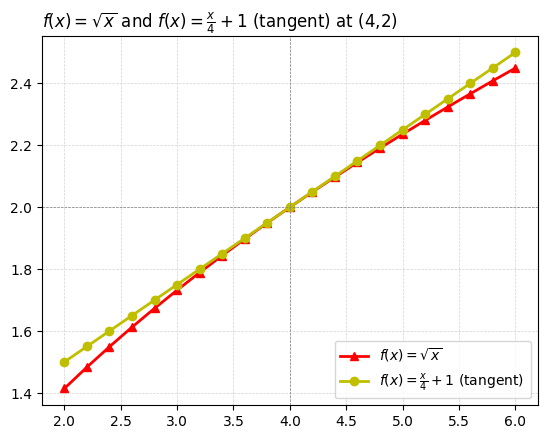
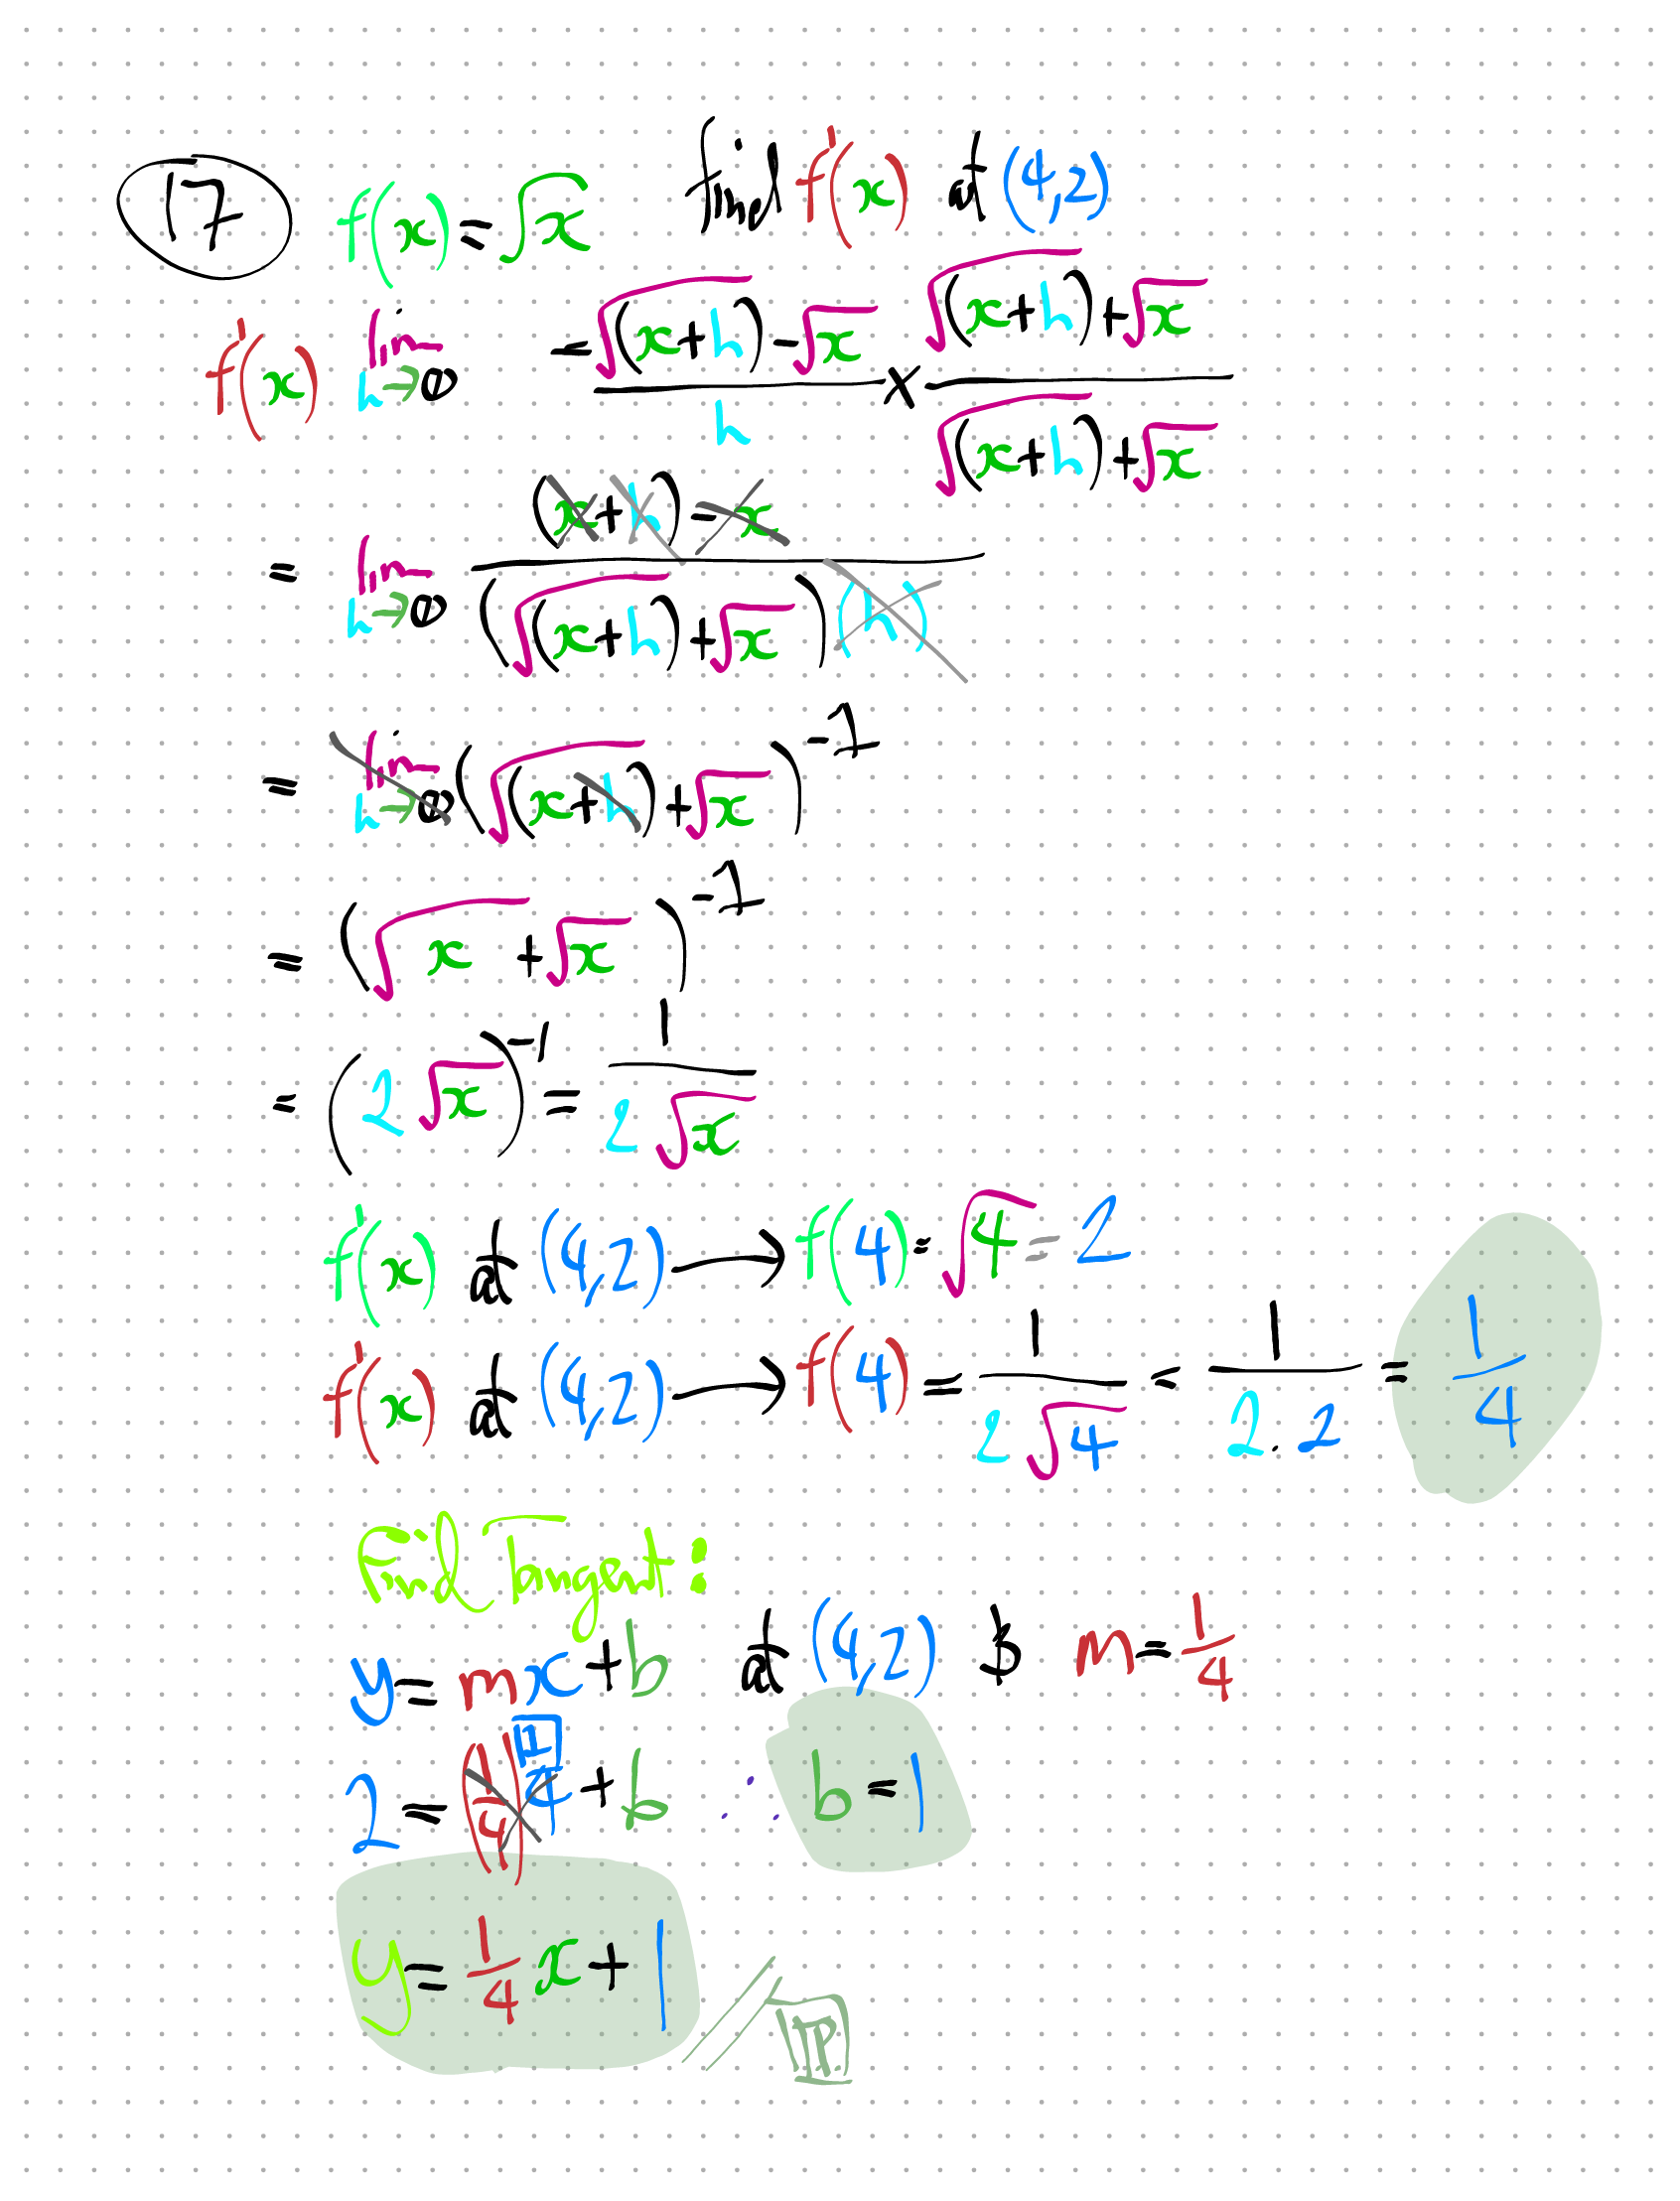
1. Question
Assume:
- \(f(x)=\sqrt{x}\)
At \((4,2)\), Find:
- \(f'(x)\)
- \(Tangent\)
2. Working-Out (Hand-written)
3. Charts (Python)
x_at_c = 4
x_deviation = 2
x_increments = 21
xs_min = x_at_c-x_deviation
xs_max = x_at_c+x_deviation
xs = np.linspace(xs_min, xs_max, x_increments)

# # X-EXCLUDE LIMIT VALUE
# xs = xs[xs != 0]
xs = xs[xs >= 0]

lbl_numerator = r'$f(x)=\sqrt{x}$'
fx_numerator = lambda x: np.sqrt(x)
ys_numerator = fx_numerator(xs)

# lbl_denom = r'$f(x)=x-2$'
# fx_denom = lambda x: x-2
# ys_denom = fx_denom(xs)

lbl_tangent = r'$f(x)=\frac{x}{4}+1$ (tangent) '
fx_tangent = lambda x: x/4+1
ys_tangent = fx_tangent(xs)


# plot_title = lbl_numerator + "at (4,2)"
# plot_title = lbl_denom + " and " + lbl_denom + "at (3,3)"
plot_title = lbl_numerator + " and " + lbl_tangent + "at (4,2)"

plt.plot(xs, ys_numerator,  'r^-', linewidth=2, markersize=6, label=lbl_numerator)
# plt.plot(xs, ys_denom,      'bo-', linewidth=2, markersize=8, label=lbl_denom)
# plt.plot(xs, ys_tangent,      'bo-', linewidth=2, markersize=6, label=lbl_tangent)
plt.plot(xs, ys_tangent,      'yo-', linewidth=2, markersize=6, label=lbl_tangent)
# plt.scatter(xs, ys, marker="o")

# zoom and enhance!
# plt.xlim(3.5, 4.5)  # X-axis range
# plt.ylim(1.8, 2.2)  # Y-axis range
# plt.xlim(-0.1, 0.1)  # X-axis range
# plt.ylim(-0.1, 0.1)  # Y-axis range

# Add grid, title, and legend
plt.grid(color='lightgrey', linestyle='--', linewidth=0.5)
plt.title(plot_title, loc='left')
# plt.title(r"$12*x+16$", loc='left')
# plt.legend(loc='upper right')
plt.legend(loc='lower right')

# Optionally, add vertical and horizontal lines to highlight the zoomed area
ax = plt.gca()  # Get the current axis
ax.axvline(x=4, color='grey', linestyle='--', linewidth=0.5)
ax.axhline(y=2, color='grey', linestyle='--', linewidth=0.5)

# # X-LIMIT & VALUE
# plt.vlines(x_at_c,linestyles="dotted", ymin=plt.ylim()[0], ymax=max(ys)) # non-monotonic
# # plt.plot(x_at_c, 0.5,marker="o",markersize=15, markerfacecolor='none', markeredgecolor='red')

# # OTHER
# # # b+-- , o:b , r^ , bo    plt.xlabel("")
# # plt.ylim(bottom=0)  # chart starts from y=0
# # ax.yaxis.set_minor_locator(ticker.MultipleLocator(0.000025)) # minor ticks
# # ref: https://matplotlib.org/stable/users/explain/axes/axes_ticks.html
# ##################### FINAL FUNCTION #####################
# x_at_c = 3
# x_deviation = 3
# x_increments = 51
# xs_min = x_at_c-x_deviation
# xs_max = x_at_c+x_deviation
# xs = np.linspace(xs_min, xs_max, x_increments)

# # # X-EXCLUDE LIMIT VALUE
# xs = xs[xs != 2]

# # lbl_numerator = r'$f(x)=x$'
# # fx_numerator = lambda x: x
# # ys_numerator = fx_numerator(xs)

# # lbl_denom = r'$f(x)=x-2$'
# # fx_denom = lambda x: x-2
# # ys_denom = fx_denom(xs)

# lbl_fx = r'$f(x)=\frac{x}{x-2}$'
# fx_fx = lambda x: (x)/(x-2)
# ys_fx = fx_fx(xs)

# # plot_title = lbl_denom + " and " + lbl_denom + "at (3,3)"
# plot_title = lbl_fx

# # plt.plot(xs, ys_numerator,  'r^-', linewidth=2, markersize=8, label=lbl_numerator)
# # plt.plot(xs, ys_denom,      'bo-', linewidth=2, markersize=8, label=lbl_denom)
# plt.scatter(xs, ys_fx, marker="o", label=lbl_fx)

# # zoom and enhance!
# # plt.xlim(-5, 1)  # X-axis range
# plt.ylim(-8,8)  # Y-axis range
# plt.xlim(-2, 7)  # X-axis range
# # plt.ylim(-3.1, 3.1)  # Y-axis range

# # Add grid, title, and legend
# plt.grid(color='lightgrey', linestyle='--', linewidth=0.5)
# plt.title(plot_title, loc='left')
# # plt.title(r"$12*x+16$", loc='left')
# plt.legend(loc='upper right')

# # Optionally, add vertical and horizontal lines to highlight the zoomed area
# ax = plt.gca()  # Get the current axis
# ax.axvline(x=3, color='grey', linestyle='--', linewidth=0.5)
# ax.axhline(y=3, color='grey', linestyle='--', linewidth=0.5)