xs = np.linspace(-12, 12, 97)
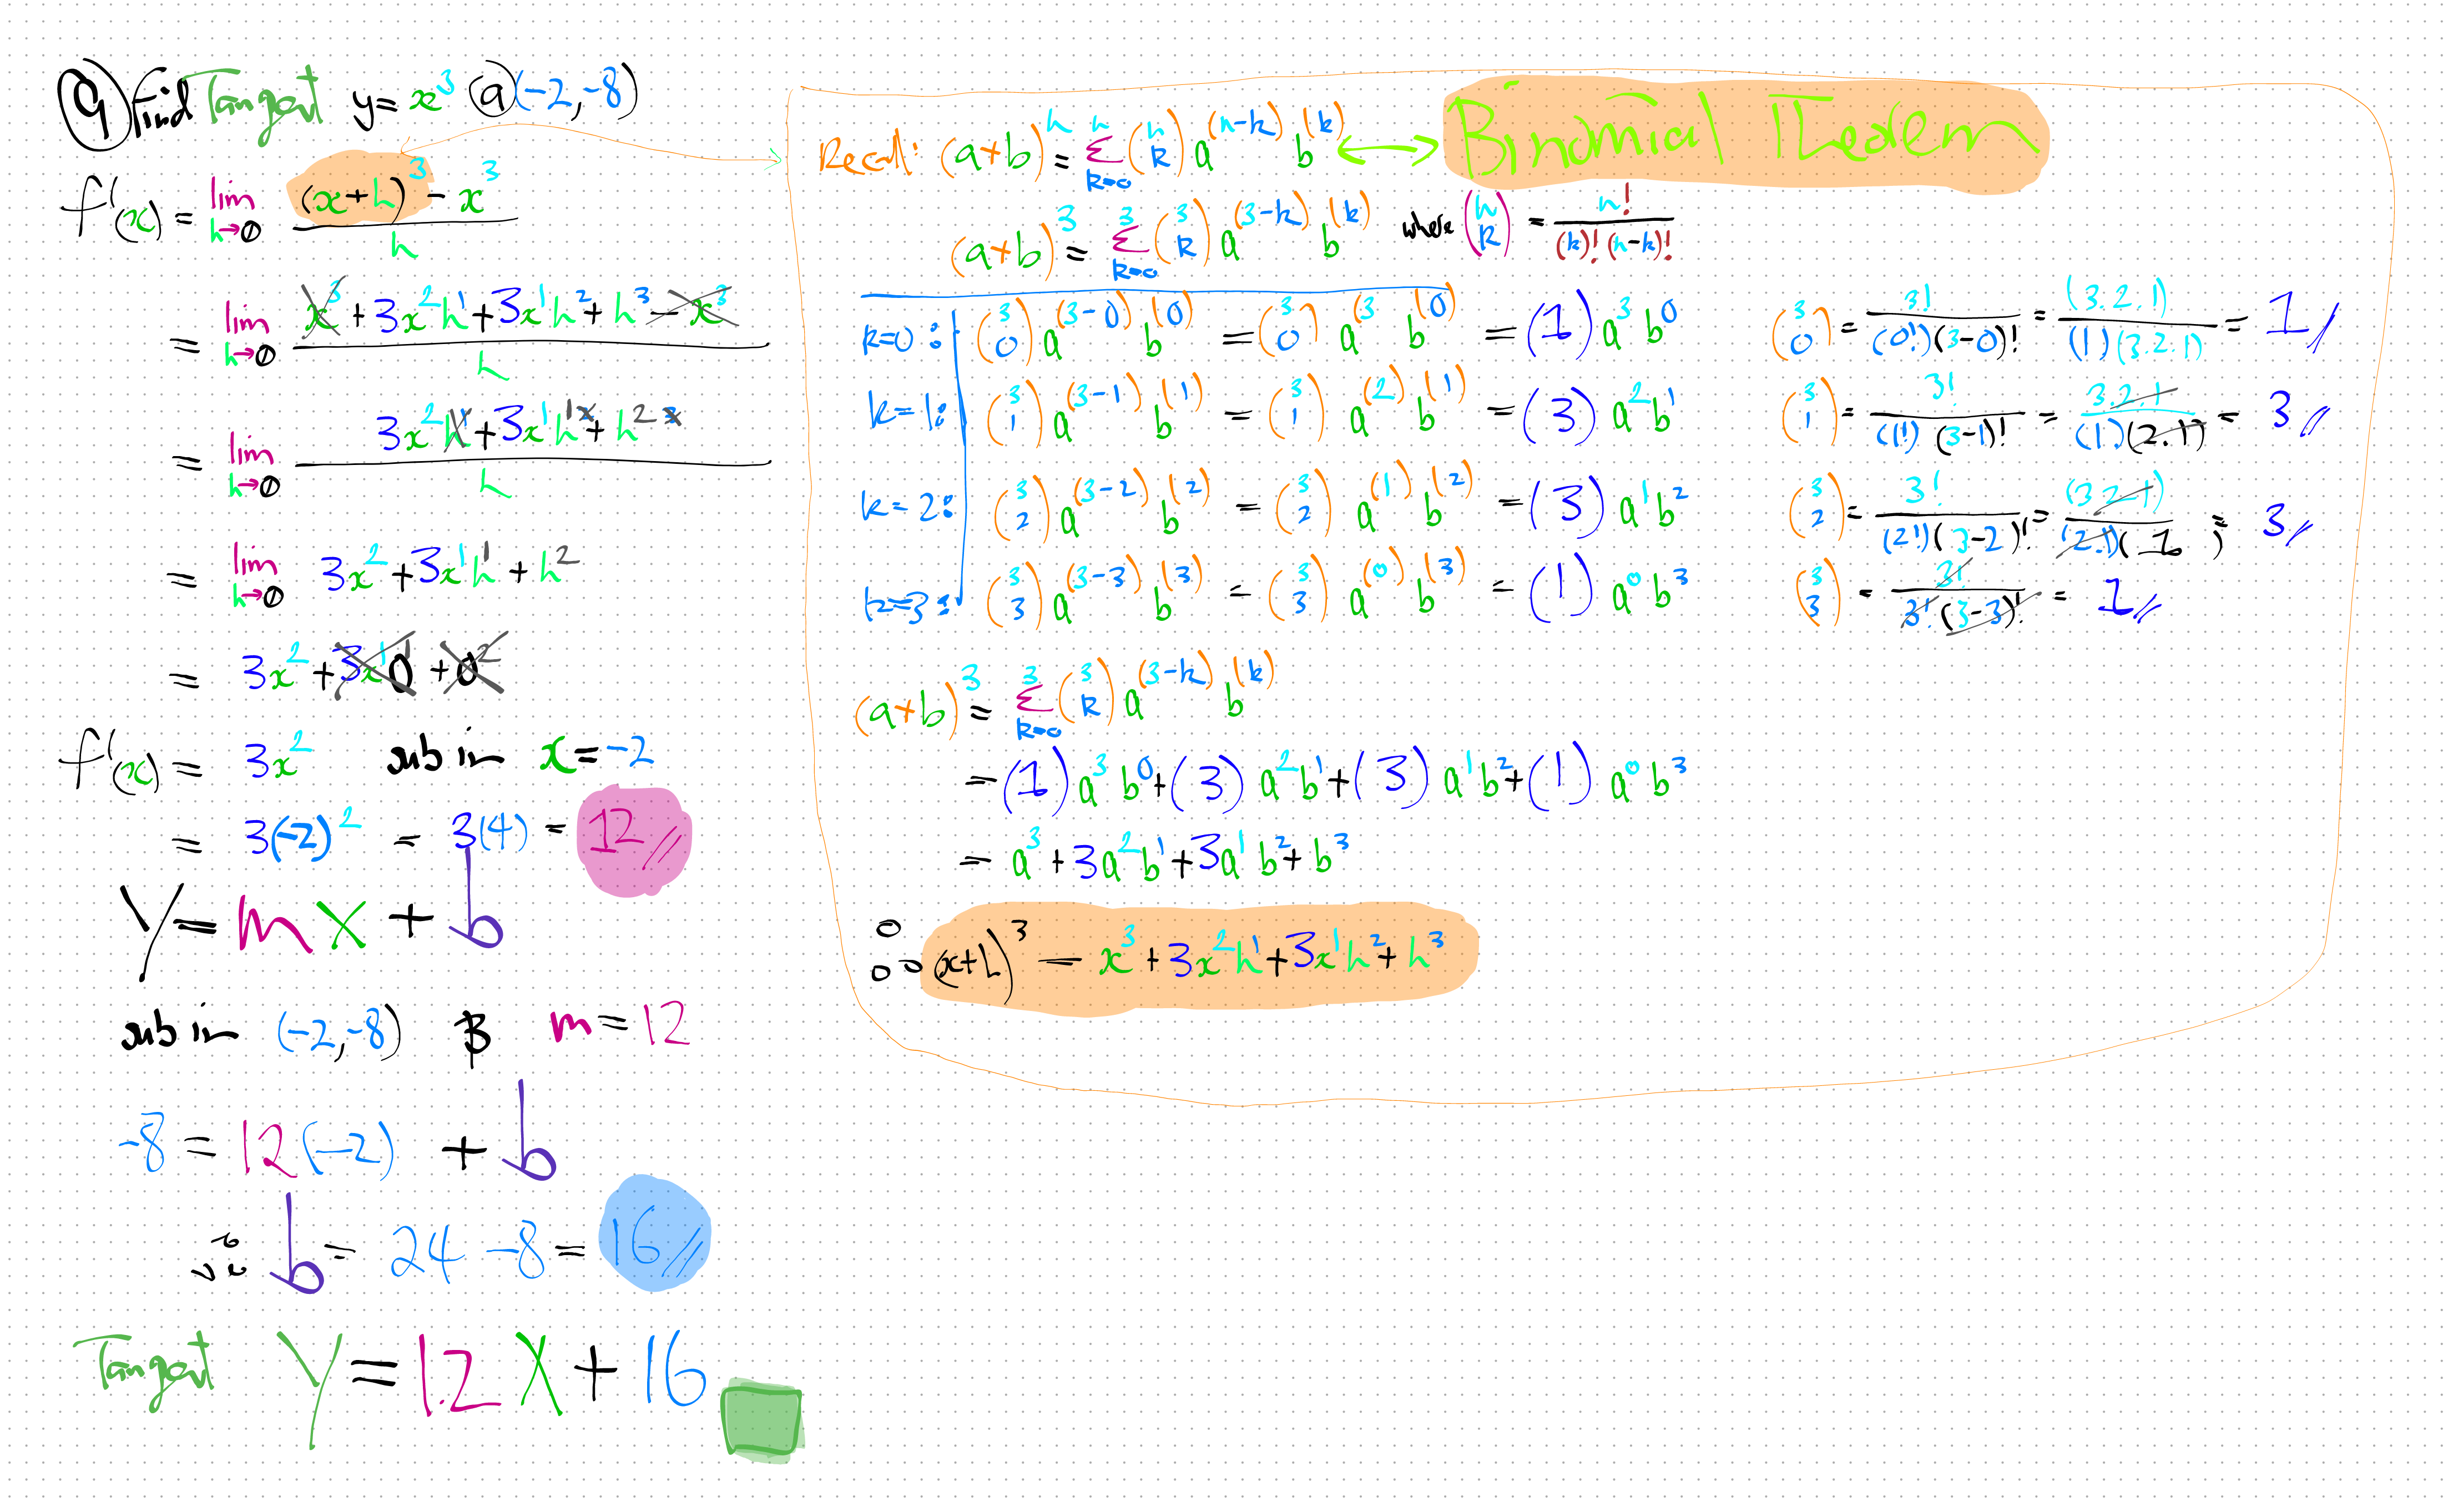
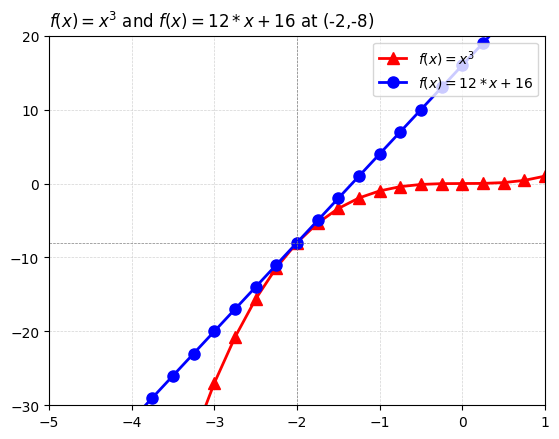
fx_numerator = lambda x: (x**3)
ys_numerator = fx_numerator(xs)
fx_denom = lambda x: 12*x+16
ys_denom = fx_denom(xs)
# Plot the lines
# $\lim_{x\to0} \frac{2x^2}{3-3\cos{x}}$
plt.plot(xs, ys_numerator, 'r^-', linewidth=2, markersize=8, label=r'$f(x)=x^3$')
plt.plot(xs, ys_denom, 'bo-', linewidth=2, markersize=8, label=r'$f(x)=12*x+16$')
# Zoom to region
plt.xlim(-5, 1) # X-axis range
plt.ylim(-30, 20) # Y-axis range
# plt.xlim(-0.1, 0.1) # X-axis range
# plt.ylim(-0.1, 0.1) # Y-axis range
# Add grid, title, and legend
plt.grid(color='lightgrey', linestyle='--', linewidth=0.5)
plt.title(r"$f(x)=x^3$ and $f(x)=12*x+16$ at (-2,-8)", loc='left')
# plt.title(r"$12*x+16$", loc='left')
plt.legend(loc='upper right')
# Optionally, add vertical and horizontal lines to highlight the zoomed area
ax = plt.gca() # Get the current axis
ax.axvline(x=-2, color='grey', linestyle='--', linewidth=0.5)
ax.axhline(y=-8, color='grey', linestyle='--', linewidth=0.5)