import pandas as pd
import numpy as np
import matplotlib.pyplot as plt
xs = np.linspace(-0.1,0.1,20)
xs = xs[xs != 0] # remove x=0
def f(x): return (x)/(np.abs(x))
ys = f(xs)
plt.scatter(xs,ys)
plt.grid(True)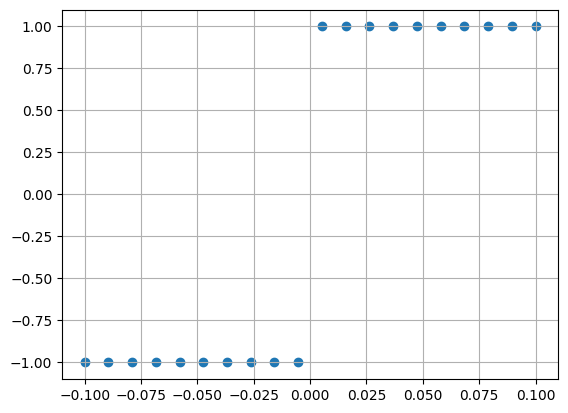
import pandas as pd
import numpy as np
import matplotlib.pyplot as plt
xs = np.linspace(-0.1,0.1,20)
xs = xs[xs != 0] # remove x=0
def f(x): return (x)/(np.abs(x))
ys = f(xs)
plt.scatter(xs,ys)
plt.grid(True)
xs = np.linspace(-3.1, -2.9, 50)
def fx(x): return (x**2-13)
ys = fx(xs)
y_x_at_c = fx(-3)# at x=-3
y_x_at_c
plt.scatter(xs,ys)
plt.grid(True)
plt.vlines(x=-3, ymax=100, ymin=-100, linestyles="dotted")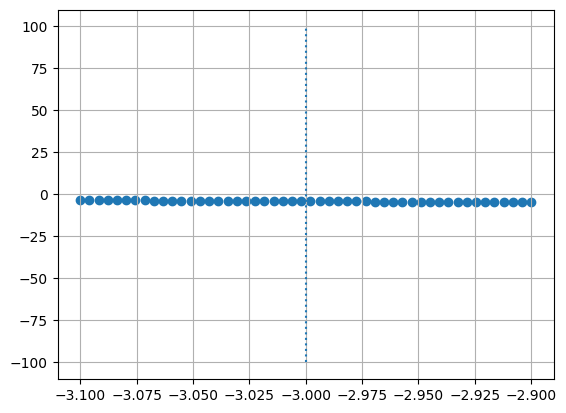
x_at_c, abt_x = 6,0.1
x_abt_c = (x_at_c - 0.1, x_at_c + 0.1)
xs = np.linspace(x_abt_c[0],x_abt_c[1], 20) # same as np.linspace(5.9, 6.1)
def fx(x): return 8*(x-5)*(x-7)
ys=fx(xs)
plt.scatter(xs,ys)
plt.grid(True)
y_x_at_c = fx(x=x_at_c)
plt.vlines(x=x_at_c, ymax=10,ymin=-10, linestyles='dotted')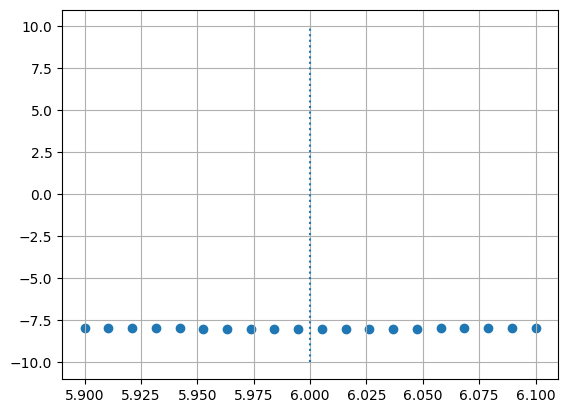
import numpy as np
import matplotlib.pyplot as plt
x_at_c = 2
abt_c = 0.1
xs_min = x_at_c - abt_c
xs_max = x_at_c + abt_c
xs = np.linspace(xs_min,xs_max,20)
def fx(x): return (2*x+5)/(11-x**3)
ys = fx(xs)
plt.scatter(xs, ys, marker="+")
plt.grid(True)
plt.vlines(x=x_at_c,linestyles="dotted", ymax=fx(xs_max),ymin=fx(xs_min))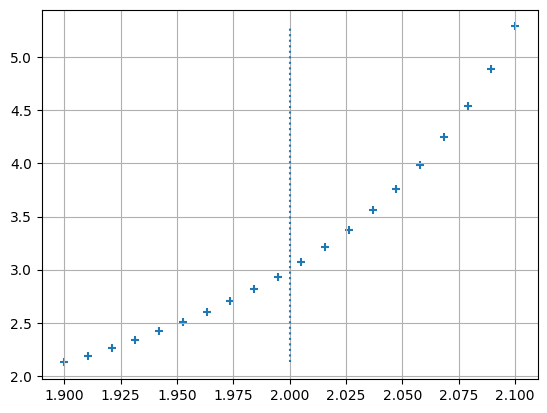
import numpy as np
import matplotlib.pyplot as plt
x_at_c = -3
abt_c = 0.1
xs_min = x_at_c - abt_c
xs_max = x_at_c + abt_c
xs = np.linspace(xs_min,xs_max,20)
def fx(x): return (5-x)**(4/3)
ys = fx(xs)
plt.scatter(xs, ys, marker="+")
plt.grid(True)
plt.vlines(x=x_at_c,linestyles="dotted", ymax=fx(xs_max),ymin=fx(xs_min))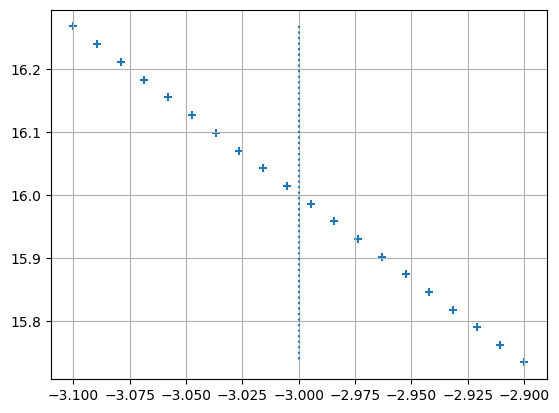
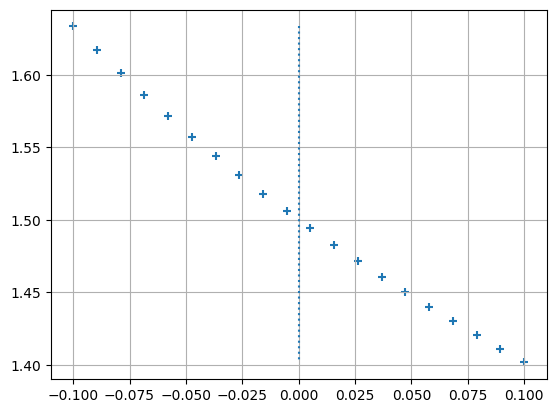
import numpy as np
import matplotlib.pyplot as plt
x_at_c = 0
abt_c = 0.1
xs_min = x_at_c - abt_c
xs_max = x_at_c + abt_c
xs = np.linspace(xs_min,xs_max,20)
def fx(x): return 3/(np.sqrt(3*x+1)+1)
ys = fx(xs)
plt.scatter(xs, ys, marker="+")
plt.grid(True)
plt.vlines(x=x_at_c,linestyles="dotted", ymax=fx(xs_max),ymin=fx(xs_min))