def bubble_sort(arr):
    # print(f"Imported array: {arr}")
    last_idx_unsorted = len(arr)-1
    sorted = False
    ctr_compare, ctr_swap = 0,0
    while not sorted:
        sorted = True
        # print(f"Sorting array: {arr[0:last_idx_unsorted+1]}")
        for i in range(last_idx_unsorted):
            ctr_compare+=1
            if arr[i]>arr[i+1]:
                arr[i],arr[i+1]=arr[i+1],arr[i]
                ctr_swap+=1
                sorted = False
        last_idx_unsorted-=1
    n_total_steps = ctr_compare+ctr_swap
    # print(f"sorted_array: {arr}, nsteps: {n_total_steps}")
    return None, n_total_steps
    # return arr, n_total_steps
# arr = [5,4,3,2,1]
# bubble_sort(arr)
1. \(BubbleSort()\) Function (with n_total_steps counter)
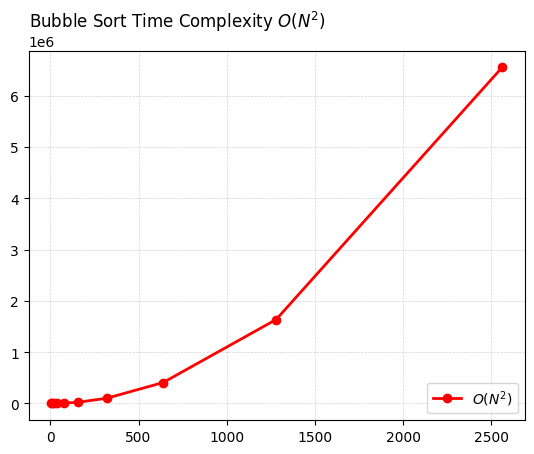
2. Chart (very inefficient data creation)
size_param=10
arr_tbl = [None]*size_param
to_val = 5

for i in range(size_param):
    arr = list(range(to_val,0,-1))
    print(f"arr_size: {len(arr)}")
    _, nsteps = bubble_sort(arr)
    arr_size = len(arr)
    arr_tbl[i]=[arr_size,nsteps]
    to_val=2*to_val
xs = []
ys = []
arr_size: 5
arr_size: 10
arr_size: 20
arr_size: 40
arr_size: 80
arr_size: 160
arr_size: 320
arr_size: 640
arr_size: 1280
arr_size: 2560for i,v in enumerate(arr_tbl):
xs.append(v[0])
ys.append(v[1])
print(xs)
print(ys) [5, 10, 20, 40, 80, 160, 320, 640, 1280, 2560]
[20, 90, 380, 1560, 6320, 25440, 102080, 408960, 1637120, 6551040]import numpy as np
import matplotlib.pyplot as plt
plot_title = rf"Bubble Sort Time Complexity $O(N^2)$"
lbl_plt = rf"$O(N^2)$"
plt.plot(xs, ys, 'ro-', linewidth=2, markersize=6, label=lbl_plt)
plt.grid(color='lightgrey', linestyle='--', linewidth=0.5)
plt.title(plot_title, loc='left')
plt.legend(loc='lower right')